SEC595: Applied Data Science and AI/Machine Learning for Cybersecurity Professionals
SEC595Cyber Defense, Artificial Intelligence


Last Month at the SANS360, I promised the release of the Timeline Template to be used to automatically colorize your timelines.
The EXCEL TEMPLATE can be downloaded here.
To use the template you must currently use MS EXCEL 2007 or higher. Hopefully we can get other formats of this created, but think this is a start to help out with analysis of log2timeline data.
To learn how to create timelines: Read these articles
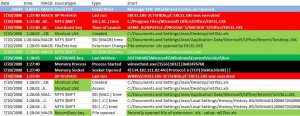
Your chart should now look like this once you start filtering your data to the elements you are looking for.
Another Example
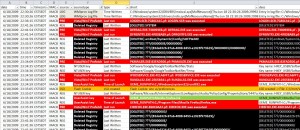
This chart will also help you with analysis of the colorized artifacts from our FOR408 Windows In-Depth Course
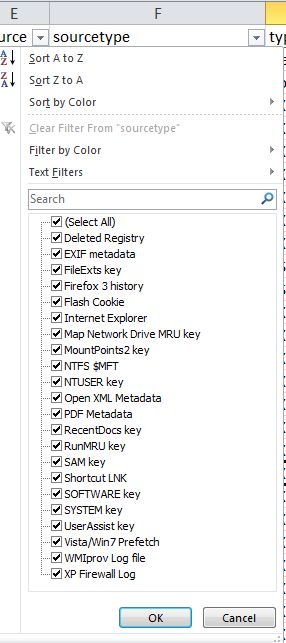
To select specific artifacts of interest you can select them from the source, sourcetype, type, or short columns. Below is an example of FILTERING using the drop down filter for the Sourcetype column. If you wanted look for specific data types and eliminate others, this is a great place to start.
More articles on analysis techniques are coming, but the color spreadsheet needs some polish still.